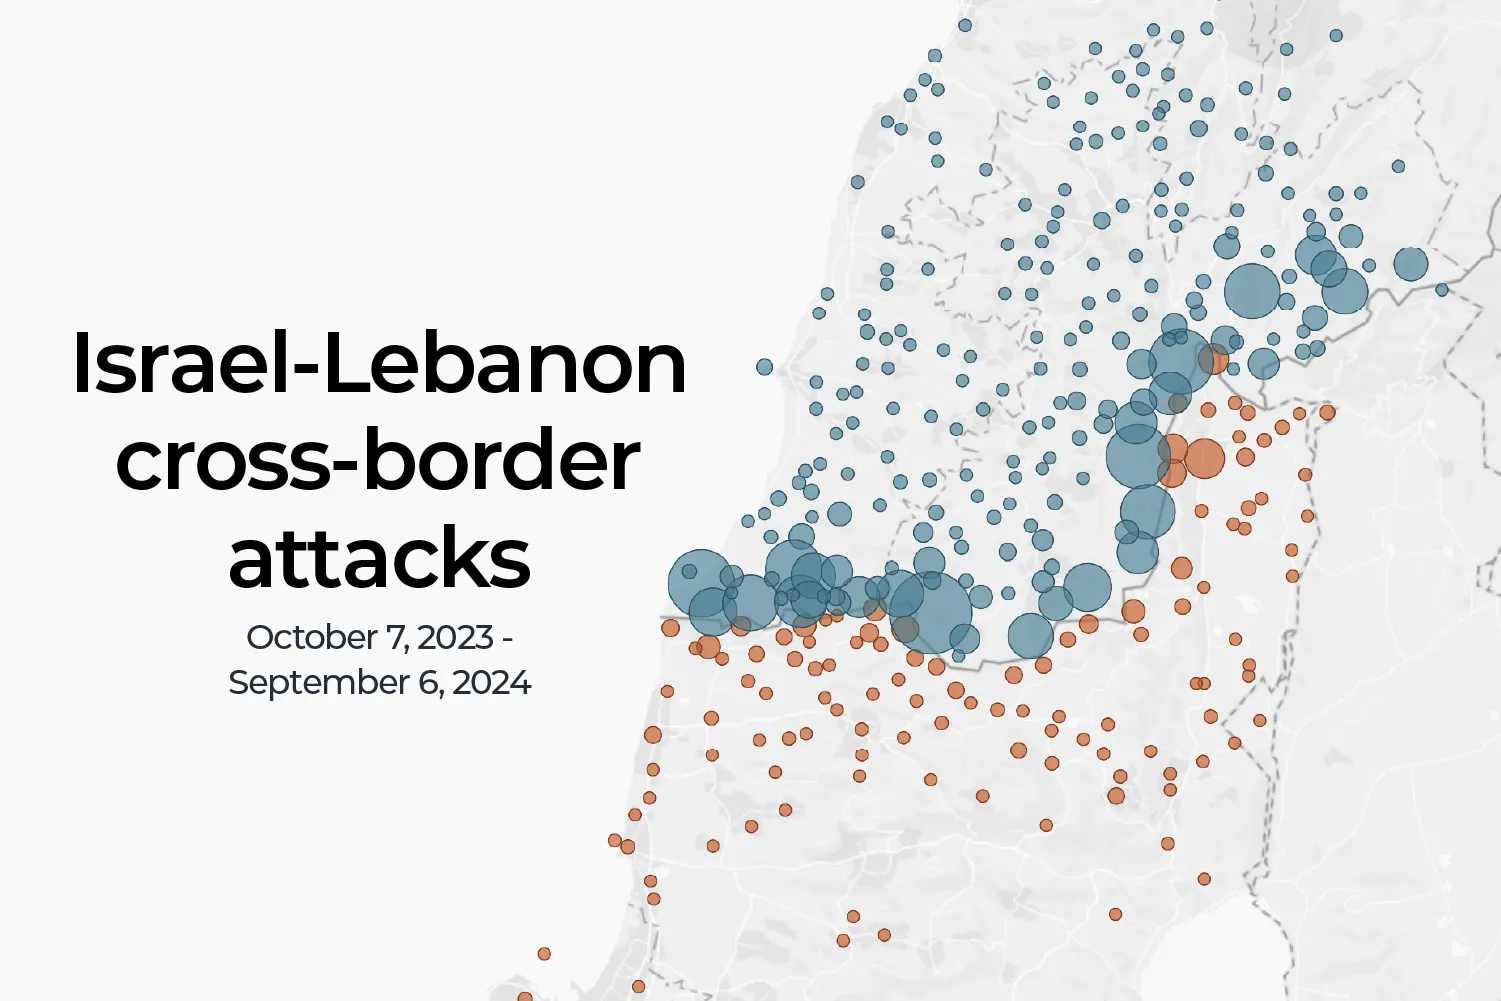
Reuters Maps the Israel-Palestine Conflict with Interactive Infographic

Interactive Infographic of the Israel-Palestine Conflict
In an eye-catching display, Reuters has created an interactive infographic that encapsulates the ongoing conflict in the Middle East. For 11 months, both Israel and Lebanon have experienced cross-border attacks, demonstrating the region’s escalating tensions.
Key Highlights from the Infographic
- Visual maps detailing the attacks
- Timelines showcasing specific incidents
- Statistics on casualties and damages
This infographic serves not just as a news update but as a vital tool for those looking to grasp the ongoing complexities of the Israel-Palestine conflict.
This article was prepared using information from open sources in accordance with the principles of Ethical Policy. The editorial team is not responsible for absolute accuracy, as it relies on data from the sources referenced.