Wall Street's 'Fear Gauge' Peaks in October During Election Years
October Patterns in Wall Street's 'Fear Gauge'
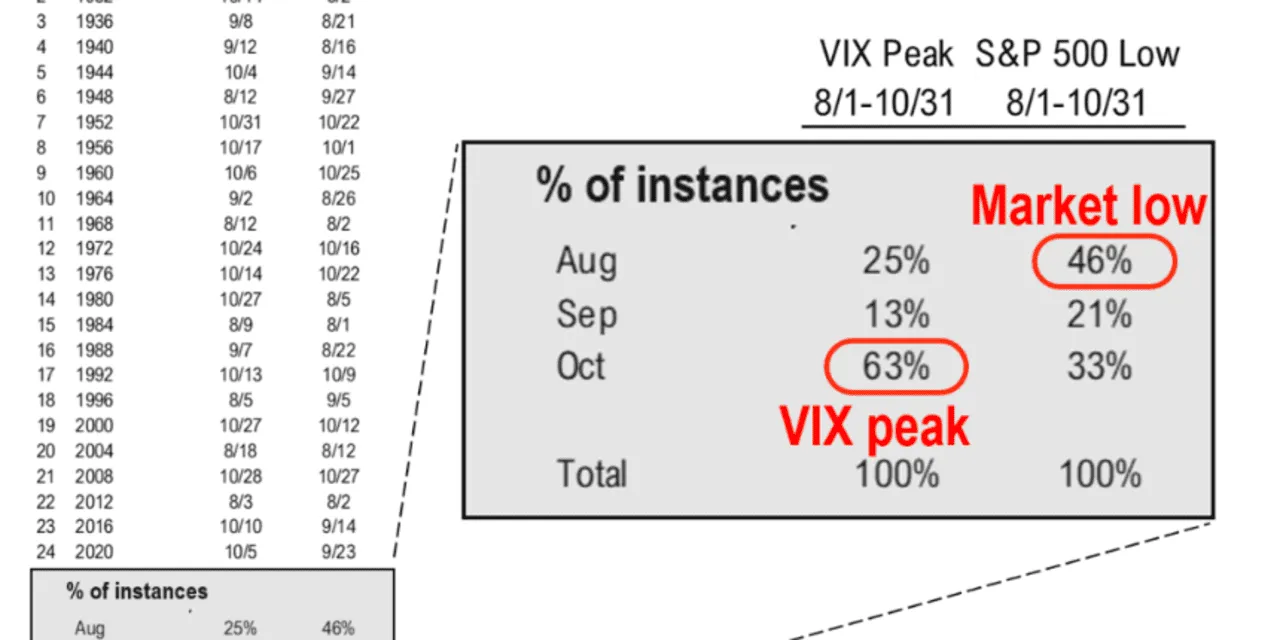
Wall Street's fear gauge, the Cboe Volatility Index (VIX), is known to peak during October, particularly in election years. Historical data reveals that markets can undergo extreme fluctuations, leading to potential investment risks.
What the Data Shows
According to Fundstrat, the data indicates patterns where trading volatility increases as election season approaches. Investors historically witness a rise in market unpredictability, which may signal strategic moves for portfolio adjustments.
- Key Insight: The VIX often spikes in October.
- Investor Strategy: Prepare for potential market shifts.
Market Implications
Understanding these patterns in the VIX can provide investors with valuable context for making informed decisions. The influence of macroeconomic factors and sentiment during election cycles plays a critical role in shaping market forecasts.
This article was prepared using information from open sources in accordance with the principles of Ethical Policy. The editorial team is not responsible for absolute accuracy, as it relies on data from the sources referenced.