TradingView Unveils Tick Charts: A Game Changer for Traders

Wednesday, 7 August 2024, 13:11

TradingView has rolled out a beta version of its tick charts feature, addressing a long-standing request from its user community. This new feature allows traders to visualize price movements based on the number of trades rather than time intervals. As tick charts can provide a clearer view of market volatility and liquidity, they are expected to enhance trading strategies and decision-making processes. Overall, this development marks a significant addition to TradingView's platform and underlines its commitment to innovation.
Fxnewsgroup
TradingView Unveils Tick Charts: A Game Changer for Traders

Introduction of Tick Charts

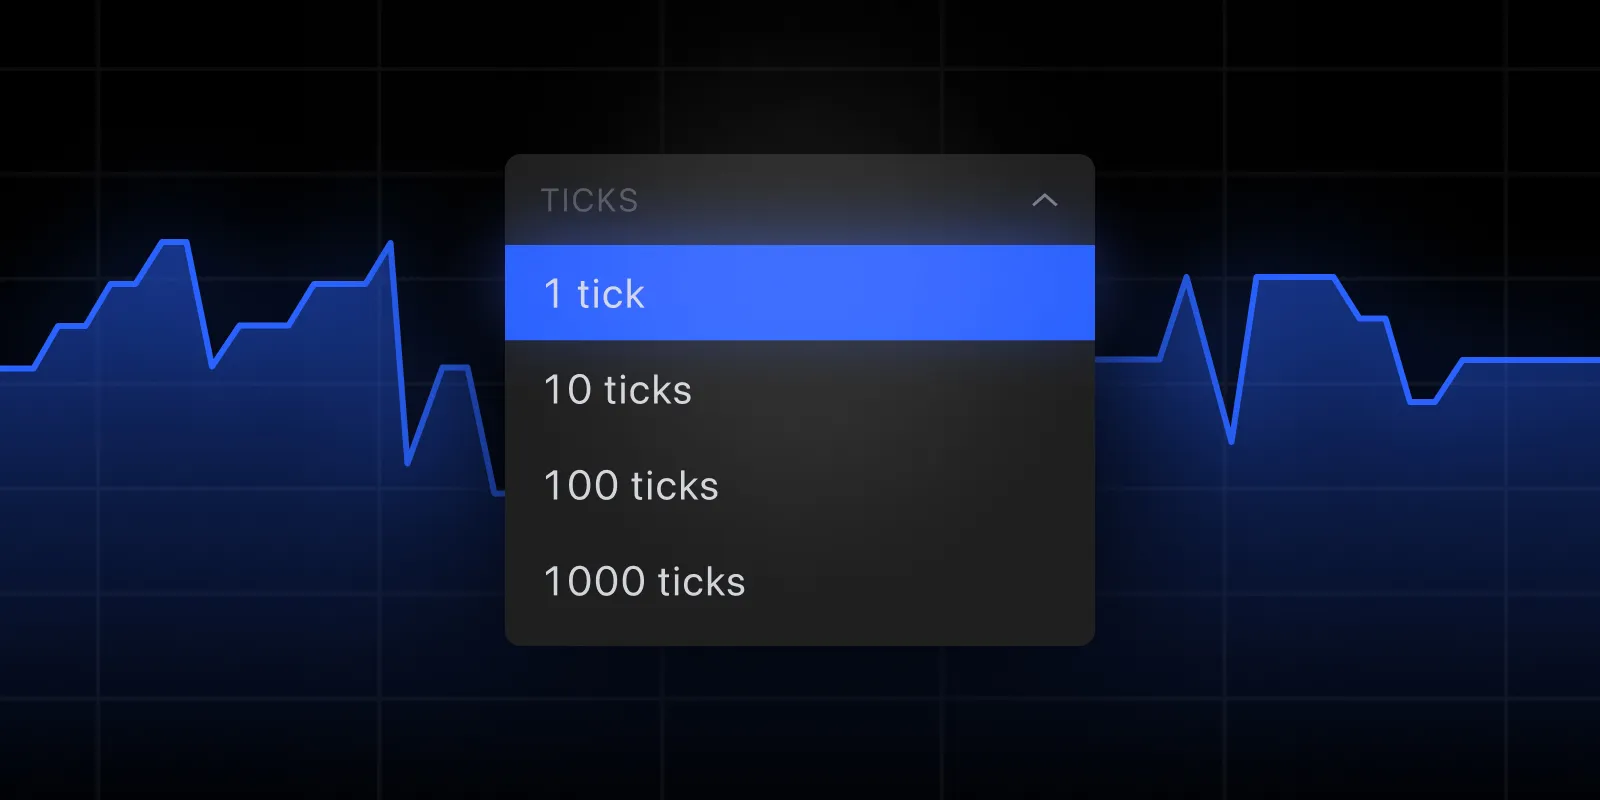
Today, TradingView introduced one of the most historically requested features: tick charts (in beta).

Feature Overview

  • Tick charts update based on the number of trades.
  • They provide insights into market activity and price movement.
  • Enhanced visualization helps traders assess liquidity and volatility.

Conclusion

The launch of tick charts offers traders a new perspective on navigating the markets, reinforcing TradingView's position as a leader in financial analytics tools.


This article was prepared using information from open sources in accordance with the principles of Ethical Policy. The editorial team is not responsible for absolute accuracy, as it relies on data from the sources referenced.


Related posts


Newsletter

Get the most reliable and up-to-date financial news with our curated selections. Subscribe to our newsletter for convenient access and enhance your analytical work effortlessly.

Subscribe